Version:
1.0.2
What is the bug:
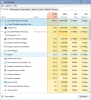
As I play and fly arround or do anything really. Every 10-20Mins I get a lag spike that slowly lowers my fps until it's around 1. I looked at the percentage chart and it's the Tick rate that goes to 99.9% Usually at 8-12%.I do have a decent computer I can run and play most any game on High to very high. But it seams to be this modpack alone that has this error.
Mod & Version:
Paste.feed-the-beast.com log:
Can it be repeated:
- Happens on its own
Known Fix:
The only thing that works is completely closing the game. Just leaving the server and rejoining won't help!
1.0.2
What is the bug:
As I play and fly arround or do anything really. Every 10-20Mins I get a lag spike that slowly lowers my fps until it's around 1. I looked at the percentage chart and it's the Tick rate that goes to 99.9% Usually at 8-12%.I do have a decent computer I can run and play most any game on High to very high. But it seams to be this modpack alone that has this error.
Mod & Version:
Paste.feed-the-beast.com log:
Can it be repeated:
- Happens on its own
Known Fix:
The only thing that works is completely closing the game. Just leaving the server and rejoining won't help!